
SmartDatabase and SmartCharts
Imagine, if you could have a comprehensive database with all the information you collected on the marketing mix over the years,and such data would be available in its marketing context at a click?
Imagine, if your entire database would automatically update itself at a click in real time as you enter new information?
Imagine, if your database would even reveal which information is still missing to get a better insight in your business at a click?
Imagine,how such database would improve your efficiency?
The answer to all this is MARFIN’s SmartDatabase!
To be successful, it is essential to have a comprehensive information system where the data is accessible at a click in its marketing context. That is why MARFIN created a new concept, the SmartDatabase.
What is a SmartDatabase?
It isan innovative platform where the data is entered and stored in its marketing context within a preprogrammed spreadsheet.As you enter or change information, the full marketing model is updated in real time. While many systems use charts to analyze data, MARFIN uses them as living sources for data entry, storage, and analysis.
MARFIN accomplishes all this by taking a horizontal approach to marketing planning. MARFIN breaks down the marketing planning process into more than 250 charts and graphs, which takes you from A to Z following a logical path from data and analysis to strategy development. This is the essence of the MARFIN marketing planning system.
Following this logical path gives us a new perspective. Suddenly, the bits of information that were available here and there, the various marketing theories that we learned start to make sense. We now see and understand the whole strategic thinking process, and the correlation among its components. All this because the information is presented in preprogrammed analytical charts, in their marketing context. Our creative imagination may take over. But the solid, number-based information base will keep it in check.
Using the SmartDatabase provides the following advantages:
- It identifies the information that is needed for the analysis.
- The user will always know what information is available and what information is still missing.
When a chart is shown, it contains the information that was already entered in different parts of the program, and the empty spaces where new data needs to be entered. Under each chart, there is an Explanation button. Here MARFIN identifies the data that we have to enter, and the data that was previously entered together with the information where those numbers were entered.
- We will immediately understand the strategic role of each number entered.
- The Source of Databutton at the bottom of the chart keeps records of the origin and the quality of the data entered. There is also a space to record what data is missing and what our future market research needs are. All the information related to a chart is entered for future reference right next to and linked to the chart itself.
Another unique feature of the SmartDatabase design is that each piece of data can be entered only in one place, in its designated chart. This special function ensures that the numbers entered are as realistic as possible, as well as guards against duplicated entry ensuring consistency.
If a number does not make sense when we look at it in another context (in another chart), then we will have to return to the chart where it was originally entered. That is the only place where adjustments can be made. And it is the only place where we have the necessary information available for making realistic adjustments.
An essential part of the SmartDatabase is MARFIN's other, unique concept: the SmartChart. The SmartDatabase and SmartChart work together to provide the planner with a new and exclusive marketing platform.
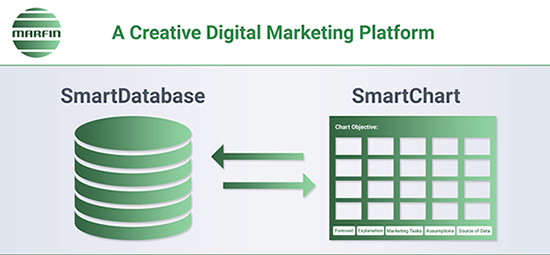
What is a SmartChart?
It is a chart that has a predetermined task which it needs to perform within the marketing planning process.
The MARFIN SmartCharts have three functions: they serve for data entry; they facilitate analysis, and finally they aid in developing strategies. The structure of each chart and the corresponding specially-designed function keys make MARFIN unique.
The first function of a SmartChart is data entry. In the top menu, MARFIN lists the information that needs to be entered in each chart. This is a general list. It might need adaptation if your business has special characteristics.
Next, by clicking on the question mark (?) at the end of the title of each chart, we access the description of the chart’s objective. It explains the special role of the chart in the marketing planning process and the insight it needs to provide. By describing our marketing task, MARFIN actually translates the information into practical application. This makes a chart a SmartChart.
Here is an example, Chart 1.3.
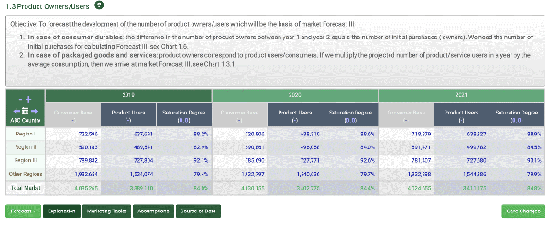
To further understand the chart’s role in the planning process, MARFIN created several function keys which we can find under each chart:
Forecast - We find the Forecast button under those charts where the marketing tasks involve trend analysis and forecasts of one or more variables, like market size, brand shares and advertising spending. The MARFIN forecast function uses the standard time series methods: moving averages and exponential smoothing. MARFIN is very flexible. If your company uses more sophisticated forecasting models, they can easily be incorporated in the platform.
Chart Explanation - With this button, we can access a description of how the chart functions. It lists the data that MARFIN enters. These are the numbers we already entered in another chart. The program also identifies the chart where those numbers were originally entered, and this is also the place to where you will have to return should you wish to change their values. It also lists the data we should enter and describes the tasks we have to perform.
Marketing Tasks – This function was designed to familiarize the user with the basic concepts of marketing and the underlying principles of the MARFIN marketing management system. It describes the marketing theory relevant to the chart, and lists the marketing tasks we need to perform; furthermore, it explains what assumptions and conclusions have to be made. It includes an explanation of the chart’s strategic meaning and how the results of the analysis will affect subsequent charts.
Assumptions - By clicking on the Assumptions button, we access MARFIN’s word processing capabilities. Here is the place where we record our assumptions and decisions made during the planning process for the task that had to be performed in a particular chart. Finally, all our decisions will be combined in to the marketing plan.
Whether we make a forecast, or decide on the strategy to follow in a certain region, we analyze various options and weigh possible threats and opportunities before making our final decisions. This thought process is very important. Unfortunately, it gets easily forgotten. That is why MARFIN designed this button where we can record this vital information.
We cannot emphasize enough the extreme usefulness of this function. These notes will help refresh our memory down the road. They will also be helpful to monitor the marketplace. If the environment changes, we will need to make adjustments to our plan. MARFIN easily facilitates such adjustments.
Source of Data - This function will also prove to be of great value. How easy it is to forget from where the numbers came? An additional benefit of having this space is that here we will be able to record observations on the quality of the data provided by the various sources. This function key is only attached to charts where data is entered, usually, the main chart.
Just like the Assumptions, the Source of Data is also a very practical feature. As time goes by, we will not remember what our thought process was when our forecasts were made, or from where the past numbers came.
Subcharts – Generally, we enter data in the main chart. The purpose of the subcharts is to take advantage of MARFIN’s number crunching capabilities. MARFIN thus rearranges the data entered in the main chart in several creative ways providing a unique insight into the business and consequently fine-tuned and better targeted strategies. In addition, we will be able to work with a higher degree of efficiency and a smaller staff. See a detailed description of MARFIN’s data handling in the article How does MARFIN make the numbers talk?
Graphs - By clicking on this button, we will be able to see the data of the main chart in several different graphs. These graphs will show the development of the key values over time or compare them in a specific year according to the selected variables. Rolling over data points will show more detailed values. The graphs are also very versatile. You can hide data sets as needed to help clarify your analysis.
In summary, the MARFIN marketing platform is an entirely new concept in marketing management. It is an interactive marketing planning system that assists marketing professionals in developing strategies for each element of the marketing mix and then combining them into a business plan. Although the program will take you through the planning process step by step, it will leave free rein to your creativity because you are in charge, it is you, not the program, who makes the decisions.